1 Global Pork Market
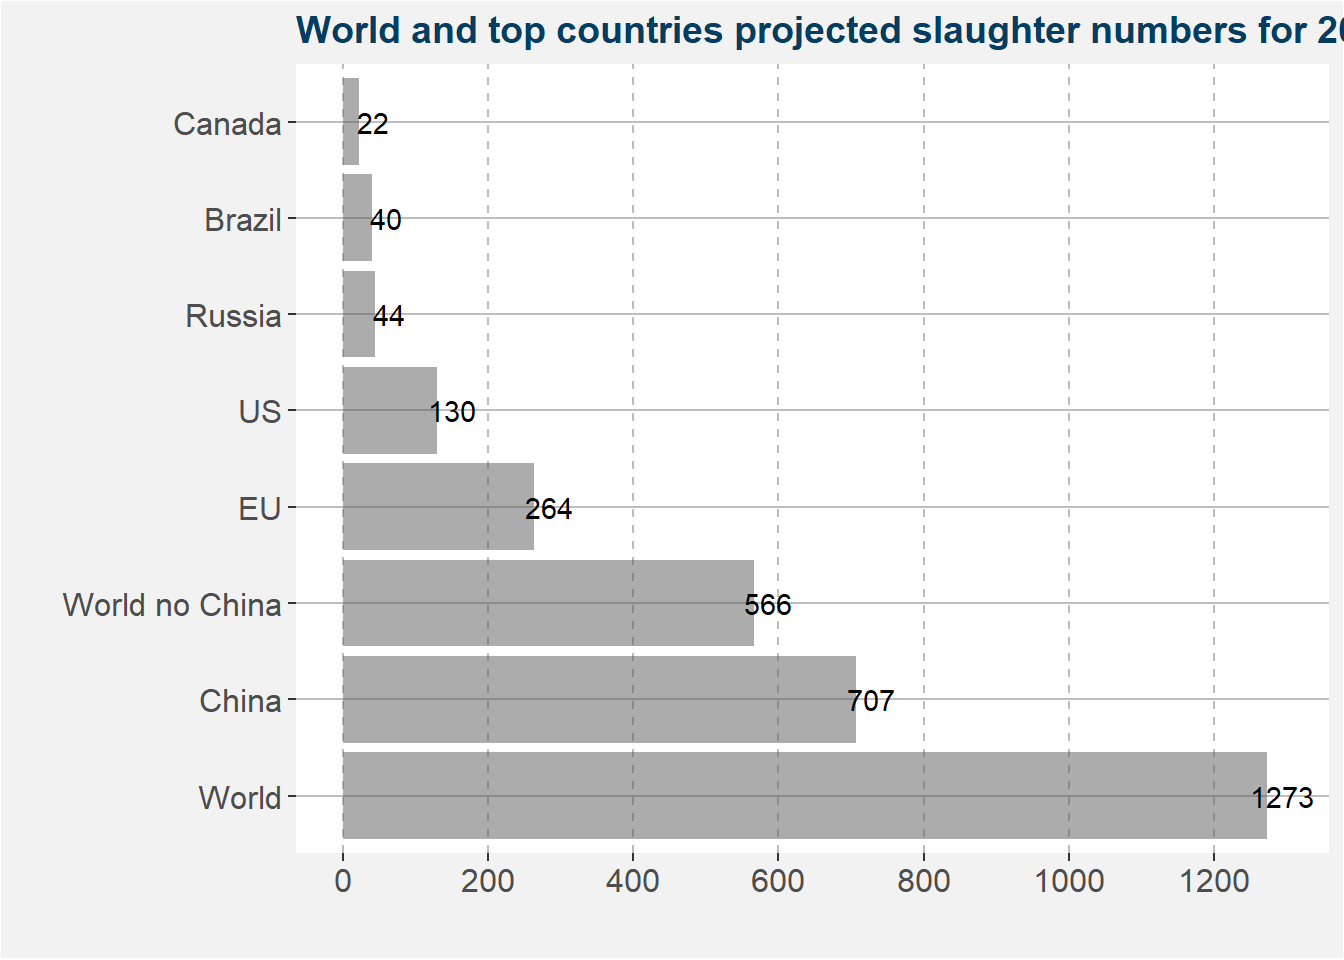
The global forcasted pork slaughter numbers is summarized in the plot below. China amounts to half of the global slaughter number. The EU slaughters abouth a third of China’s number and the US is half of the EU. Russian and Brazillian numbers are next, but don’t even combine the reach the US slaughter numbers.
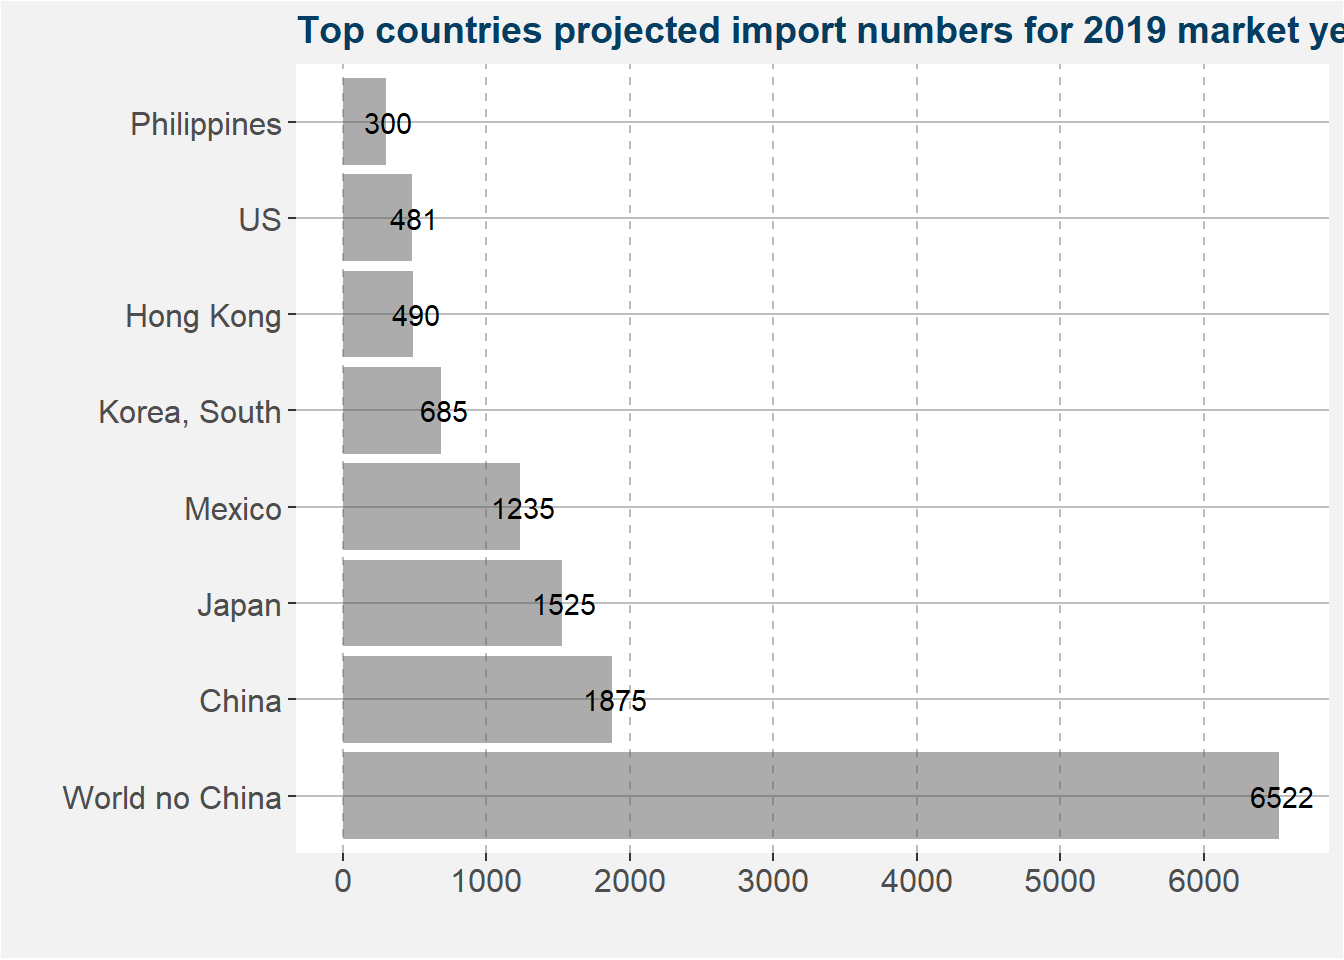
The largest importers of pork meet is shown in the plot below, units are in 1000’s of tons. It is clear that the Asian markets and Mexico have an appitite for pork. US trade relation with Japan and Mexico are key for the pork market.
2 Balance Sheets
The table below shows the US swine animal numbers balance sheet. These numbers are shown in units of 1000’s of heads. Notice the increase in projected slaughter numbers from 2018 to 2019. This amounts to an increase of 4.33%. Notice that the US have to slaughter around 10.9 million heads of swine every month to meet these projected slaughter numbers.
| 2015 | 2016 | 2017 | 2018 | 2019 | |
|---|---|---|---|---|---|
| Beginning Stocks | 67776 | 68919 | 71545 | 73445.00 | 75750.00 |
| Sow Beginning Stocks | 5939 | 6002 | 6110 | 6179.00 | 6300.00 |
| Production | 121411 | 125936 | 129467 | 133966.00 | 137810.00 |
| Imports | 5740 | 5656 | 5600 | 5625.00 | 5400.00 |
| Total Supply | 194927 | 200511 | 206612 | 213036.00 | 218960.00 |
| Total Slaughter | 115426 | 118220 | 121317 | 124991.00 | 130400.00 |
| Sow Slaughter | 2872 | 2905 | 2971 | 3035.00 | 3060.00 |
| Exports | 41 | 48 | 59 | 57.00 | 65.00 |
| Loss | 10541 | 10718 | 11791 | 12238.00 | 12845.00 |
| Total Distribution | 194927 | 200511 | 206612 | 213036.00 | 218960.00 |
| Ending Stocks | 68919 | 71525 | 73445 | 75750.00 | 75650.00 |
| Annual % Change Prod. To Sows | 2 | 3 | 1 | 2.31 | 0.88 |
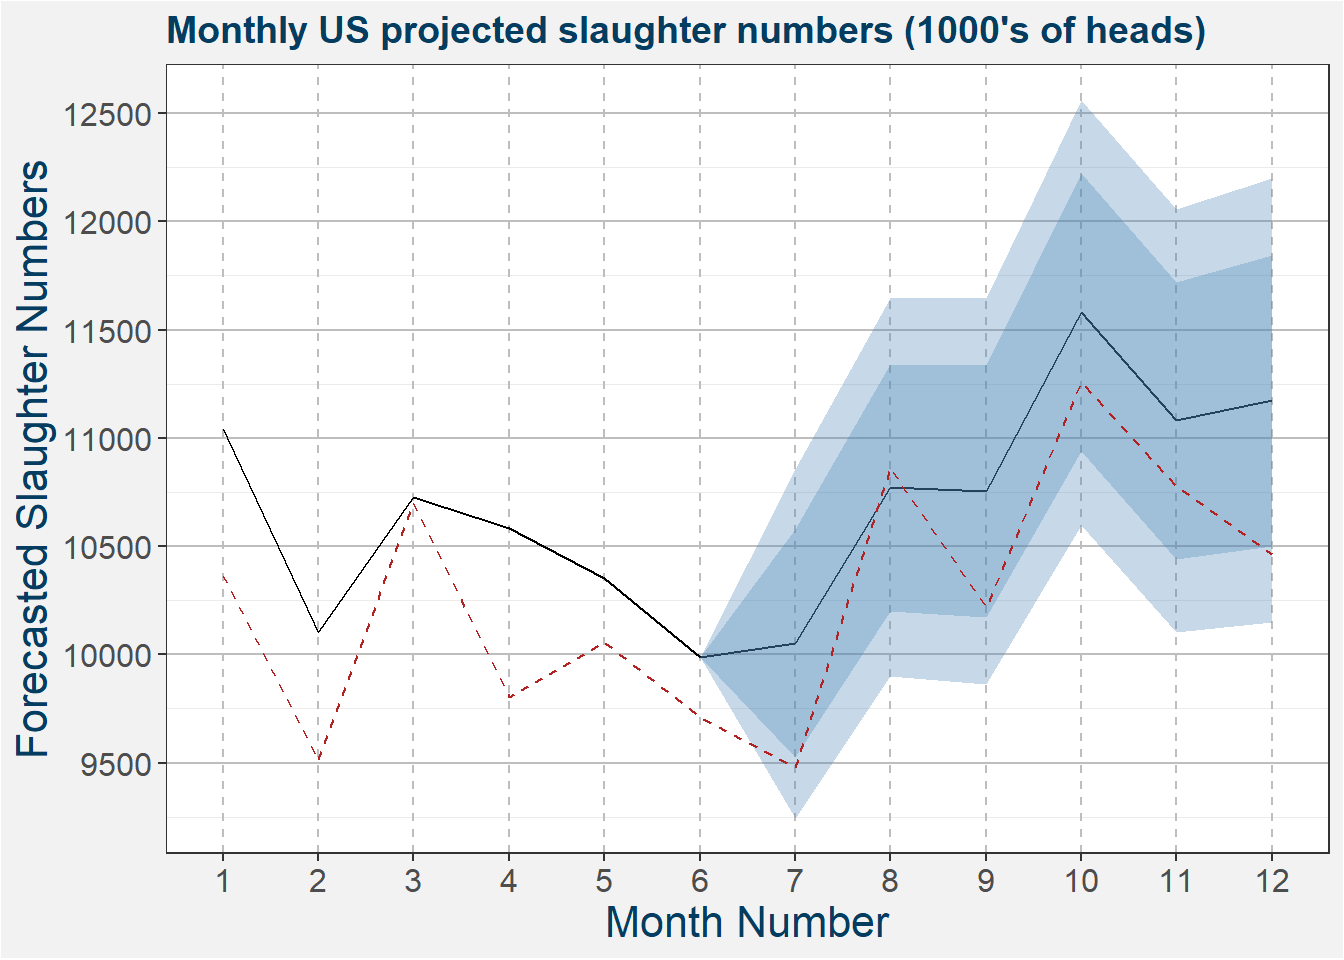
The plot below shows the monthly projected slaughter numbers. The dark and light shaded regions represent 80 and 95 percent confidence intervals. The dashed red line shows the 90th percentile of monthly US slaughter numbers. Notice that the mean projected slaughter numbers are all well above the percentile reference.
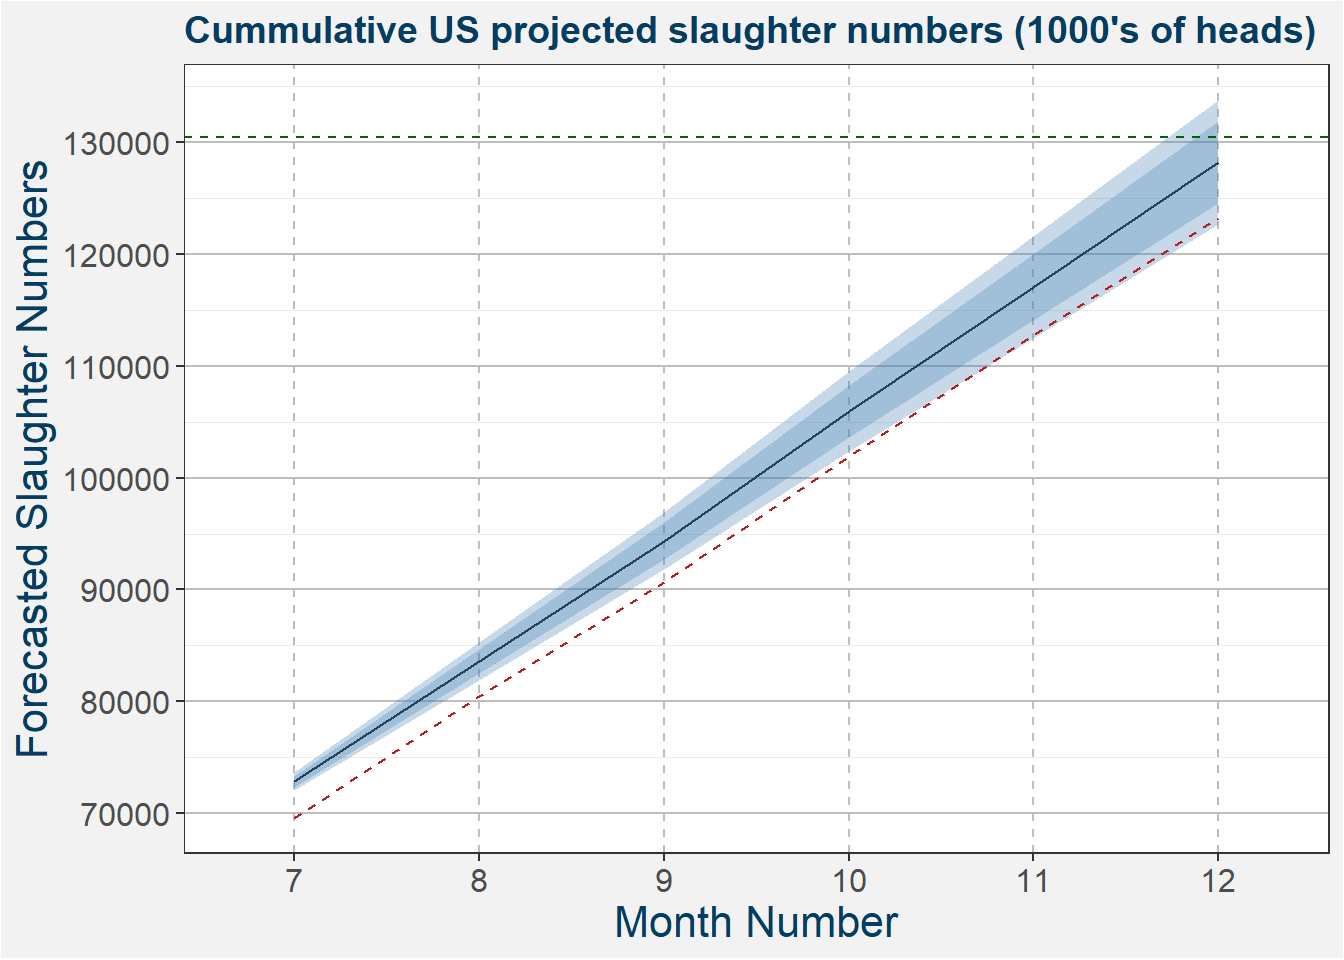
Another way to view this data is cummulatively. The plot below show the cummulative projected slaughter numbers up to December. The horizontal dashed lines shows the US projected slaughter numbers. Similar to above the dashed red line gives the 90th percentile. Notice that the mean projection will only barely reash the target set by the USDA. To be safe they will have to reash slaughter numbers greater than to top marker of the 80% confidence band.
The swine meat balance sheet for the US in shown in the table below. Here the units are in 1000’s on tons. The increase in meat production from 2018 to 2019 is 5.25%. Domestic consumption is increasing in line with production. To achieve these production numbers the US requires sufficient capacity to slaughter all the required hogs.
| 2015 | 2016 | 2017 | 2018 | 2019 | |
|---|---|---|---|---|---|
| Beginning Stocks | 253.0 | 267.00 | 230.00 | 251.0 | 249.00 |
| Production | 11121.0 | 11320.00 | 11611.00 | 11992.0 | 12621.00 |
| Imports | 506.0 | 495.00 | 506.00 | 483.0 | 481.00 |
| Total Supply | 11880.0 | 12082.00 | 12347.00 | 12726.0 | 13351.00 |
| Domestic Consumption | 9341.0 | 9475.00 | 9540.00 | 9760.0 | 10273.00 |
| Exports | 2272.0 | 2377.00 | 2556.00 | 2717.0 | 2813.00 |
| Total Distribution | 11880.0 | 12082.00 | 12347.00 | 12726.0 | 13351.00 |
| Ending Stocks | 267.0 | 230.00 | 251.00 | 249.0 | 265.00 |
| s2u | 2.3 | 1.94 | 2.08 | 2.0 | 2.03 |
| Annual % Change Per Cap. Cons. | 9.0 | 1.00 | 0.00 | 1.4 | 5.10 |
3 Monthly hog slaugter numbers
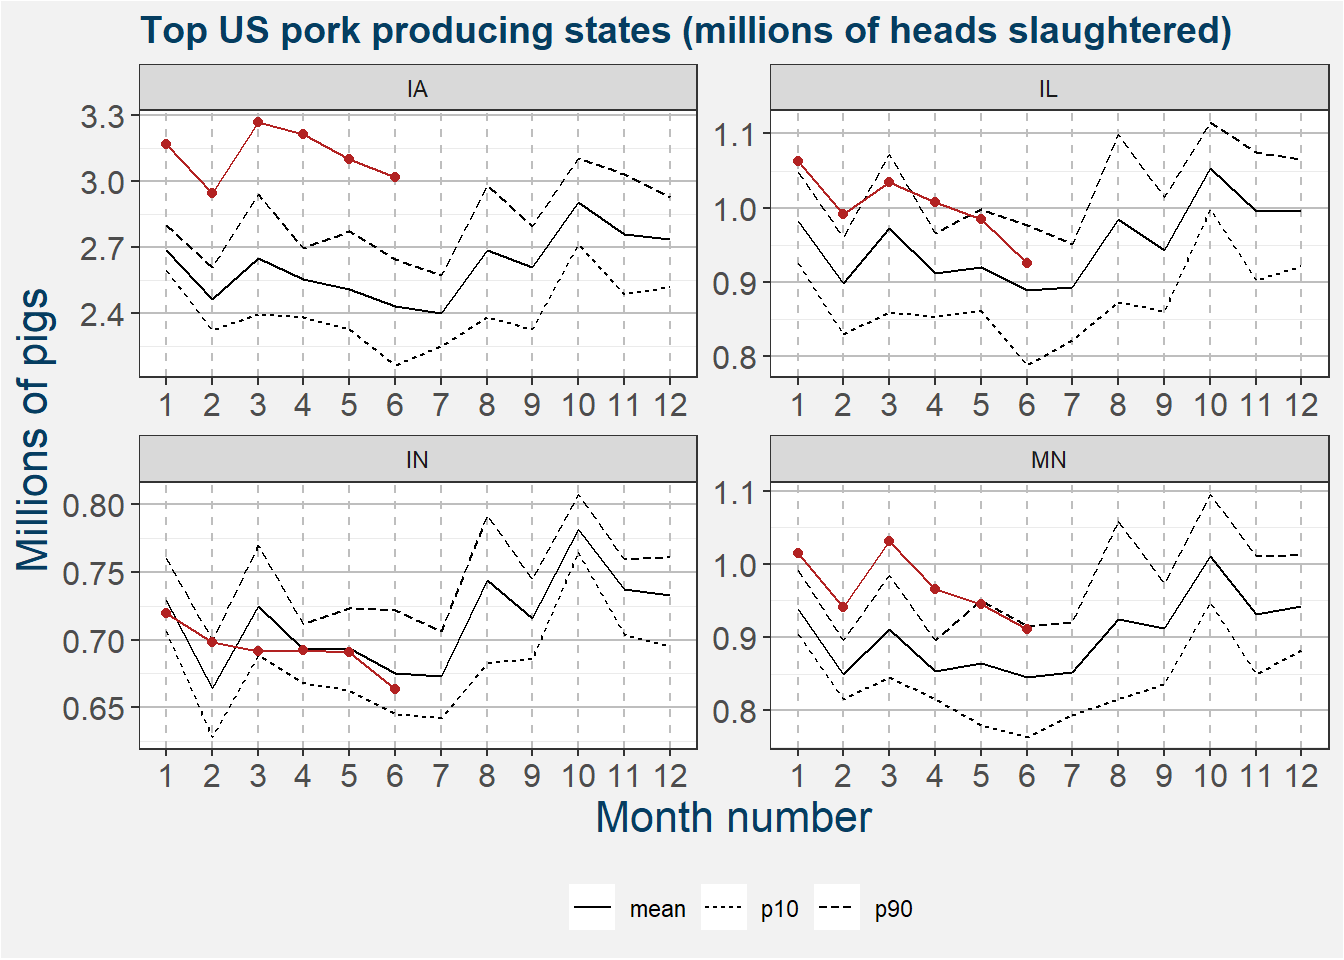
Below we show the monthly hog slaughter numbers for the top producing states reported in the latest NASS dataset. Data for the current year is shown in red. The mean slaughter numbers are represented by the solid black line. The dashed and dotted line show the 90th and 10th percentiles respectively.
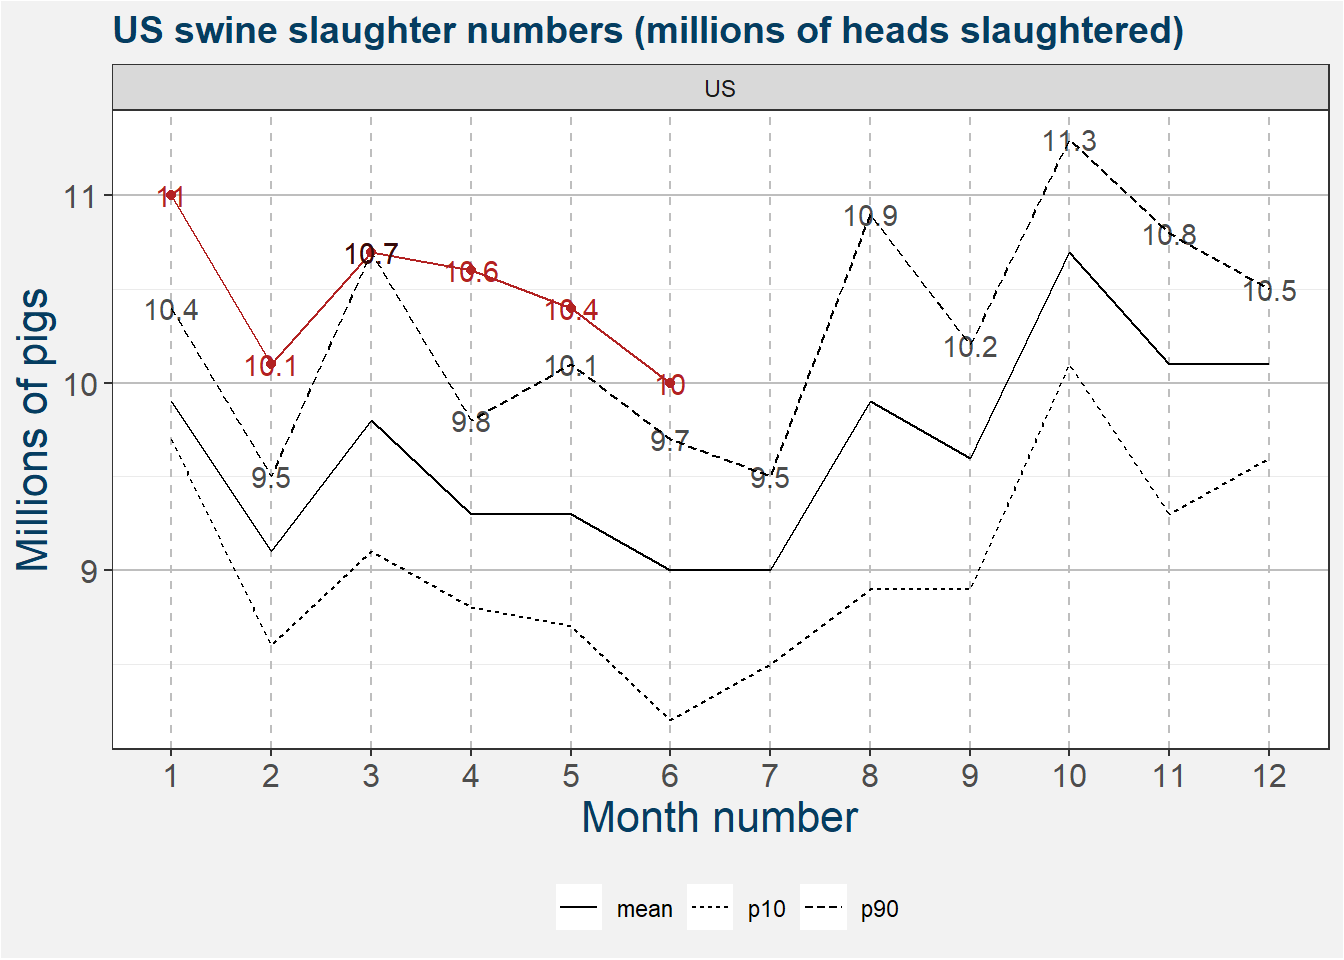
The plot below is the same as those above but shows the data on a US wide level. Here the rounded values are also shown on the graph in millions of heads.
4 Slaughtering Capacity
The table below shows the total slaughtering capacity of each state. The capacity and old columns show the spring 2017 and spring 2018 capacities respectively. This data was scraped of the pork.org website and is measured in heads of swine on a daily slaughtering basis. Iowa and Michigan will have the largest increases in plant capacity.
| type | capacity | old | change | |
|---|---|---|---|---|
| US | normal | 494535 | 483835 | 10700 |
| IA | normal | 142300 | 131500 | 10800 |
| NC | normal | 48400 | 46250 | 2150 |
| IL | normal | 47300 | 46000 | 1300 |
| MN | normal | 45100 | 45100 | 0 |
| IN | normal | 33800 | 34000 | -200 |
| MO | normal | 32000 | 34500 | -2500 |
| NE | normal | 28950 | 29500 | -550 |
| OK | normal | 20500 | 20500 | 0 |
| SD | normal | 19500 | 19500 | 0 |
| PA | normal | 15050 | 15050 | 0 |
| MI | normal | 12500 | 12500 | 0 |
| KY | normal | 10900 | 10900 | 0 |
| CA | normal | 10800 | 10800 | 0 |
| VA | normal | 10490 | 10290 | 200 |
| OH | normal | 5250 | 5550 | -300 |
| TN | normal | 3950 | 3950 | 0 |
| WI | normal | 2750 | 2850 | -100 |
| TX | normal | 1700 | 1700 | 0 |
| OR | normal | 1075 | 1075 | 0 |
| KS | normal | 1000 | 1100 | -100 |
| ID | normal | 720 | 720 | 0 |
| AL | normal | 300 | 300 | 0 |
| NJ | normal | 200 | 200 | 0 |
| type | capacity | old | change | |
|---|---|---|---|---|
| US | sow | 18990 | 18890 | 100 |
| IL | sow | 4450 | 4600 | -150 |
| IA | sow | 4000 | 4000 | 0 |
| TN | sow | 3950 | 3900 | 50 |
| WI | sow | 2750 | 2850 | -100 |
| KS | sow | 1100 | 1100 | 0 |
| OH | sow | 950 | 750 | 200 |
| KY | sow | 900 | 800 | 100 |
| MI | sow | 500 | 500 | 0 |
| AL | sow | 300 | 300 | 0 |
| VA | sow | 90 | 90 | 0 |
Below we show a google map view of where the plants are located. The radius of the marker corresonds to the plant capacity. Zooming in around the main markers we can see that the majority of the pork processing plants are located around the Des Moines area in Iowa. Clicking on the marker gives somemore information about the specific plant and its capacity. Plants with increasing capacities are shown in green. The remainder of the plants are shown in blue.
Studying the plot above we might ask if it is good practice to think of the US pork industry on a state or country wide basis. It is clear that the majority of the pork paking facilities are located around Iowa. There are two islands outside the main area, one in Oklahoma and the other in North Carolina. It is interesting to note that the West Coast don’t have great packing capacity.
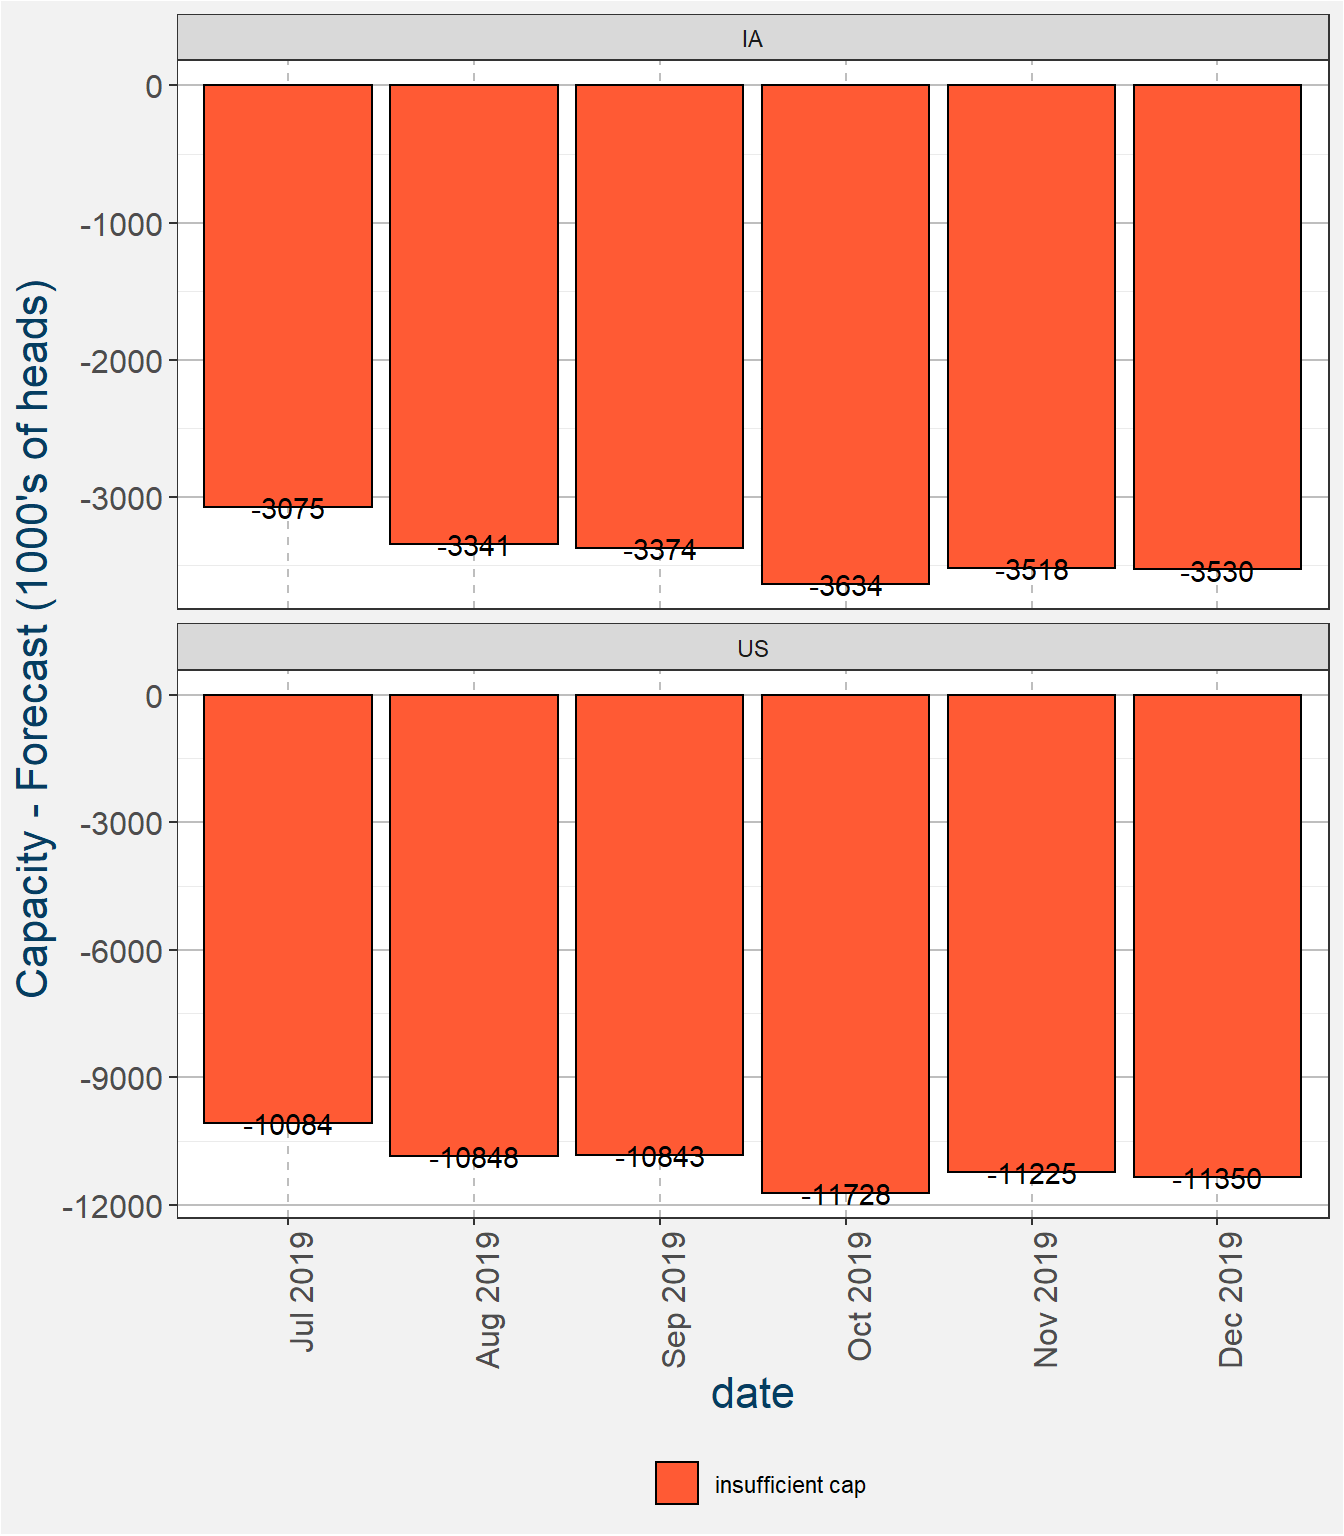
The plot below shows the difference in available capacity and the daily slaughter point forecast. A positive (negative) number implies sufficient (insufficient) capacity and is indicated as a blue (red) coloured bar. It is clear that Iowa is going to have capacity constraints going into October. These capacity constraints will be felt in the total US numbers from September 2019 through to January 2020. Throughout we use the top bar of the 80% confidence band because this gives a cummulative slaughter number that equates with the projected slaughter numbers of the USDA.
5 Remarks
- The US will have to work really hard to achieve their slaughter targets.
- This hard work will put pressure on the capacity that is available.
- In general we have a bearish pork outlook.